
Why log hotspot traffic?
Because behind the NAT, all guests share the same public address. If one day a request from an authority arrives regarding a specific address at a specific time, without a log there is no way to trace it back to the device. The log serves to link time, private address, MAC, and destination.
⚠️ Warning: the log contains personal data. Which data to keep, for how long, and how to protect them depends on the operator’s obligations: this must be decided with a consultant, not with a how-to.
In the example, the guest network is 172.16.0.0/22 on the bridge bridge-hs, as in the how-to on how to create a WiFi hotspot with MikroTik. Replace the network and names with your own.
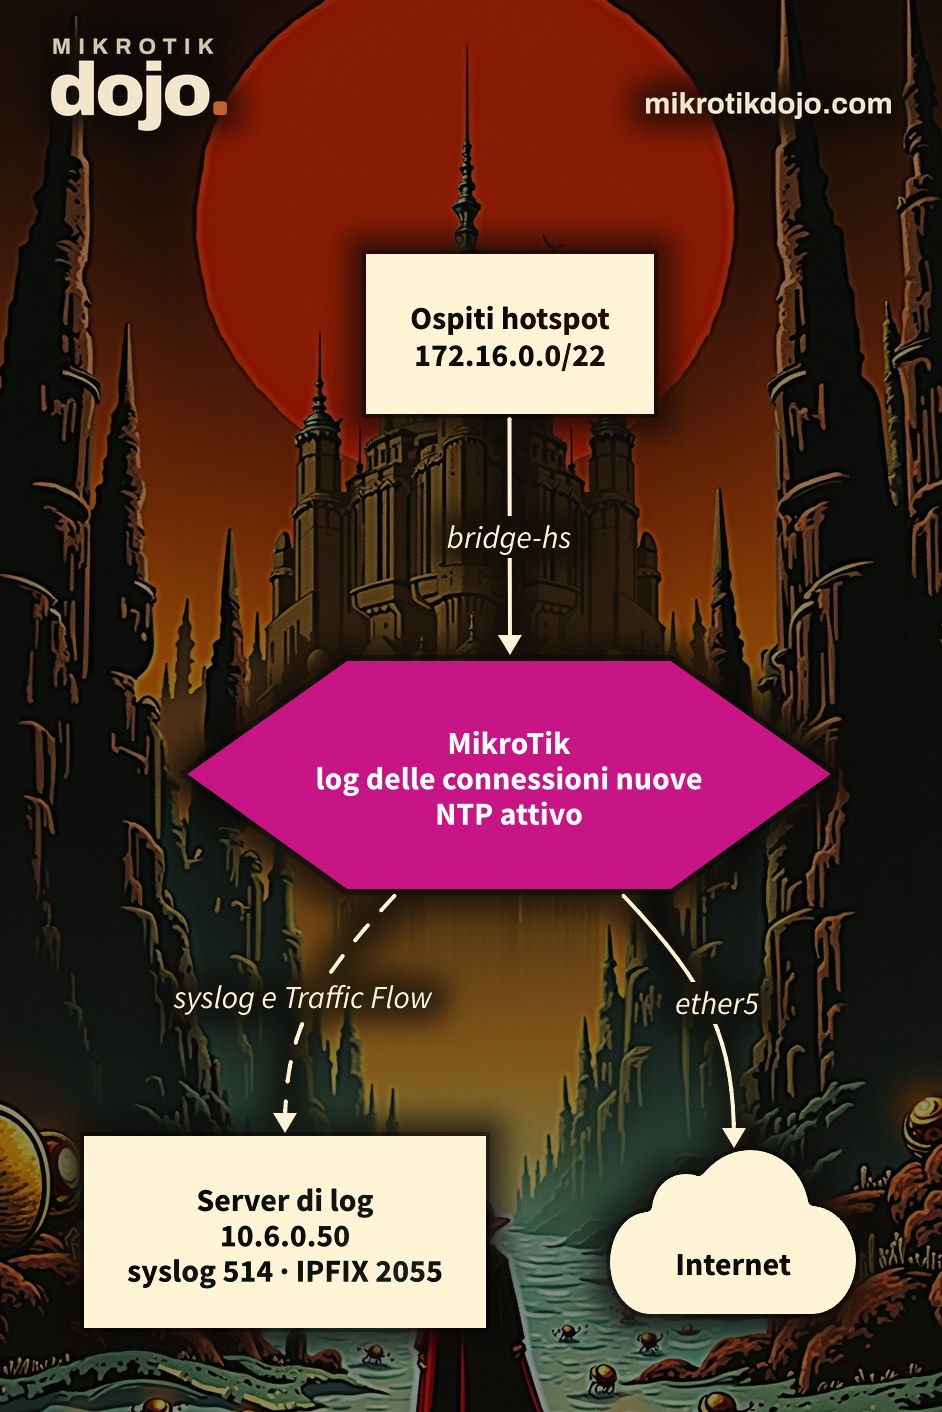
Step 1: Does the router have the correct time?
A log with the wrong time is worth as much as an empty log: the request says “at 21:14”, and you must find exactly that line. First of all, therefore, the clock:
/system ntp client set enabled=yes
/system ntp client servers add address=pool.ntp.org
/system clock set time-zone-name=Europe/Rome
Check that the NTP client is synchronized:
/system ntp client printStep 2: How do I log connections?
With a rule in the forward chain that logs only the first packet of each connection, not all packets: otherwise the log explodes.
/ip firewall filter add chain=forward src-address=172.16.0.0/22 connection-state=new \
    action=log log-prefix="HS" comment="Log connessioni hotspot" place-before=0
action=log writes the line and lets the packet proceed to the subsequent rules: it blocks nothing. place-before=0 places it at the top, before the rules that accept traffic in forward.
A real line, taken from my lab:
firewall,info HS forward: in:bridge-lan out:ether5, connection-state:new src-mac 50:00:00:1E:00:00, proto TCP (SYN), 192.168.88.199:44928->104.20.21.8:80, len 60All elements are present: interfaces, client MAC, protocol, source address and port, destination address and port. The logging system adds the date and time.
Step 3: Where do I save the log?
Not in the router’s memory: it is cleared on every reboot and holds only a few thousand lines. The right place is an external syslog server. In the example, it is 10.6.0.50, a server in my lab network: put the address of your syslog server.
/system logging action add name=sysloghs target=remote remote=10.6.0.50 remote-port=514
/system logging add topics=firewall action=sysloghs
/system logging add topics=hotspot,info action=sysloghs
⚠️ Warning: in RouterOS 7, the action name can only contain letters and numbers. With name=syslog-hs the router responds action name can contain only letters and numbers.
The second rule sends hotspot events to syslog as well, i.e., user logins and logouts, which are needed to link a private address to a user at a specific moment. On the server, in the lab, lines like these arrived:
hotspot,account,info,debug test (192.168.88.199): logged in
firewall,info HS forward: in:bridge-lan out:ether5, connection-state:new src-mac 50:00:00:1E:00:00, proto TCP (SYN), 192.168.88.199:44928->104.20.21.8:80, len 60
On the syslog server, keep a rotated and protected archive. Topics, actions, and examples are all in the MikroTik manual: Log.
Step 4: How do I verify that it works?
Connect a device to the hotspot, log in, and open a website. On the router:
/log print where message~"HS "
/system logging print where action=sysloghs
The first command shows you the firewall lines, the second that the rules towards syslog are present. Then check that the same lines actually arrive at the server: a configured but unreachable syslog will not warn you of anything.
Step 5: And Traffic Flow?
The firewall log writes a line of text for every new connection. Traffic Flow does a different job: the router summarizes traffic into flows (who spoke with whom, using which protocol and ports, how many packets and bytes) and sends them to a server, the collector, in a standard format: NetFlow v9 or IPFIX. These are UDP packets, compact, designed to be stored and queried, not read by eye.
There is an additional reason to choose it in a hotspot. In IPFIX, by default, RouterOS also exports the post-NAT address and port (nat-src-address and nat-src-port). The authority’s request starts exactly there: “public address X, port Y, at 21:14”. With IPFIX, each flow contains both the private address, the device MAC, and the public address and port: the path back to the device is already traced, without manually cross-referencing tables.
Router side
/ip traffic-flow set enabled=yes interfaces=bridge-hs
/ip traffic-flow target add dst-address=10.6.0.50 port=2055 version=ipfix
interfaces=bridge-hs limits collection to guest traffic; 10.6.0.50 is the collector, put your address here. The router sends closed flows: a connection idle for 15 seconds (inactive-flow-timeout) or open for more than 30 minutes (active-flow-timeout) is sent to the collector. You can check the exported fields like this:
/ip traffic-flow ipfix printServer side: nfdump
As a collector, I use nfdump, which is open source and available in the official Debian and Ubuntu packages (github.com/phaag/nfdump). Two programs: nfcapd receives the flows and saves them to disk, nfdump queries them. On Debian 12:
apt install nfdumpThe package automatically starts nfcapd listening on UDP port 2055, with data stored in /var/cache/nfdump: a new file every 5 minutes. There is nothing else to configure. If the server has a firewall, open UDP port 2055 only for the router’s address.
How long to keep them is decided by the operator, not nfdump (see the notice at the top). Once decided, for example 180 days, cleanup is done by nfexpire, to be placed in a daily cron job:
nfexpire -e /var/cache/nfdump -t 180dWhat the collector receives
In my lab, I connected a Linux PC behind a CHR with NAT and opened two websites. The PC has the private address 192.168.72.254, and the router goes out to “Internet” with 192.168.250.72. After a few seconds, the collector had these flows:
nfdump -R /var/cache/nfdump -o 'fmt:%ts %pr %sap -> %dap  NAT %nsap  %ismc %byt' 'proto tcp'

Date first seen         Proto      Src IP Addr:Port          Dst IP Addr:Port          X-Src IP Addr:Port     In src MAC Addr    Bytes
2026-10-09 13:37:22.592 TCP     192.168.72.254:50820 ->    104.20.23.154:80     NAT   192.168.250.72:50820  50:00:00:1f:00:00      447
2026-10-09 13:37:22.632 TCP      104.20.23.154:80    ->   192.168.250.72:50820  NAT    104.20.23.154:80     50:00:00:1a:00:01     1204
2026-10-09 13:37:22.832 TCP     192.168.72.254:37542 ->   130.255.112.53:443    NAT   192.168.250.72:37542  50:00:00:1f:00:00     2101
2026-10-09 13:37:22.872 TCP     130.255.112.53:443   ->   192.168.250.72:37542  NAT   130.255.112.53:443    50:00:00:1a:00:01    75334
Each connection produces two flows, one per direction. Read the third line, the outgoing one towards 130.255.112.53:443:
- Src IP Addr:Port: the device, with its private address and port,
192.168.72.254:37542; - X-Src IP Addr:Port: how Internet saw it after NAT,
192.168.250.72:37542. In a real hotspot, this is the public address; - In src MAC Addr: the device MAC,
50:00:00:1f:00:00; - Bytes: how much it sent. The website response, in the fourth line, weighs 75 KB.
The search that really matters
The request arrives: “public address 192.168.250.72, port 37542”. A single command line:
TZ=Europe/Rome nfdump -R /var/cache/nfdump -q -o 'fmt:%ts %pr %sap -> %dap %nsap %ismc' \
    'proto tcp and src xip 192.168.250.72 and src xport 37542'

2026-10-09 15:37:22.832 TCP     192.168.72.254:37542 ->   130.255.112.53:443     192.168.250.72:37542 50:00:00:1f:00:00
Here is the time, the private address, and the device MAC. With the hotspot login for that time (Step 6), you also have the user’s name. On a large archive, add -t with the time interval of the request, so nfdump reads only the files for those minutes.
⚠️ Warning: Time zone. The router sends timestamps in absolute time; nfdump displays them in the server’s time zone. My lab server is set to UTC: without TZ=Europe/Rome, the same connection appears at 13:37 instead of 15:37. With a request for “21:14”, a two-hour difference leads to finding the wrong device.
nfdump is not the only option: GoFlow2 and pmacct are also open-source collectors that read IPFIX. I tested it with nfdump. Details and MikroTik-side fields are in the MikroTik manual: Traffic Flow.
Step 6: How do I link the IP to a user?
The firewall log contains the private address and MAC; the username is in the hotspot log, on the login line. Cross-referencing them manually is tedious: there is a dedicated howto on writing the username in every log line.
Step 7: What do I check before putting it into production?
A router that stores guests’ browsing data must be the first one to be protected. If you have not done it yet, follow the Basic Hardening of a MikroTik router.
Tested in the lab on PNETLab with CHR RouterOS 7.24.5 (stable), a hotspot, and a Linux client: log rule, sending to a remote syslog server (firewall lines and hotspot logins received), NTP client. Traffic Flow in IPFIX tested on a second CHR 7.24.5 with NAT, towards nfdump 1.7.1 on Debian 12: flows received with post-NAT address and port and client MAC, search by public address and port.
Frequently asked questions
How do I log the connections of MikroTik hotspot users?
With a firewall rule in chain forward, connection-state=new, and action=log, limited to the hotspot network: it logs the first packet of each connection with addresses, ports, and client MAC.
Why should the log be sent to a syslog server?
Because the MikroTik in-memory log is limited and is lost on reboot. An external syslog server stores lines over time and allows archiving and searching them.
Why does the router reject the logging action name?
In RouterOS 7, the name of a /system logging action action can only contain letters and numbers: syslog-hs is rejected, sysloghs is fine.
What is the difference between firewall log and Traffic Flow?
The firewall log writes a text line for each new connection; Traffic Flow exports flows in NetFlow or IPFIX format, with bytes, duration, and, in IPFIX, also post-NAT address and port, towards a dedicated collector.
Which server do I use to receive Traffic Flow from a MikroTik?
A NetFlow/IPFIX collector. One open-source option is nfdump: on Debian it is installed with apt install nfdump and already listens on UDP port 2055. With nfdump you can search for a flow also by post-NAT address and port (src xip, src xport).
Does logging slow down the router?
Logging only new connections, and not all packets, has little impact. With many users, it is still advisable to send the log to an external server rather than keeping it in memory.
This howto updates a 2016 article on my old blog wirelessguru.it, now offline, to RouterOS 7.